

kelvin
-
Posts
15 -
Joined
-
Last visited
Posts posted by kelvin
-
-
Dear Tom:
I have problem about Eh-pH diagram for my case(Please see the attachments).
My questions is as follows:
Why CuCl3-- species boundary display discontinuously ?
Regards,
Kelvin
-
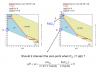
Dear Tom:
I have some problem about Eh-pH diagram for my case(Please see the attachments).
My questions are as follows:
1.Why some species boundary display discontinuously ?
2.Why some species(fig(2)&(3)) change so much after increasing 0.01 degree Celsius ?
Regards,
Kelvin
-
Dear Tom:
1.How can I know the aqueous species, minerals or gases of interest in my model that do not have log K values defined in the temperature range?
2.Whether the log K values provided by all thermo data are defined in 25C ?
Regards,
Kelvin
-
Dear Tom:
Thank you very much.
But in U06C_80.rea script, I am not sure whether I need to select the "extrapolate" option as U06C_80.act script.
When I intend to run all programs in GWB above or below 25C, the "extrapolate" option must be turn on. Is it correct?
Regards,
Kelvin
-
Dear Tom:
I will attach the script that is causing the problem to you.
Thanks.
Regards,
Kelvin
-
Dear Tom:
Thanks a lot. May I ask more question about this case?
When I run React after Basis entry, it shows the Error message "Don't know how to set charge balance:species Cl- is not in the bsais".
After balance on HCO3-, it dose not show the Error message but the Run pane shows "Residual too large".
Then I balance off HCO3-, it runs normally.
Could you tell me how to run React correctly in this case?
Regards,
Kelvin
-
Dear Tom:
The React and Act2 scripts are as attachments.
Regards,
Kelvin
-
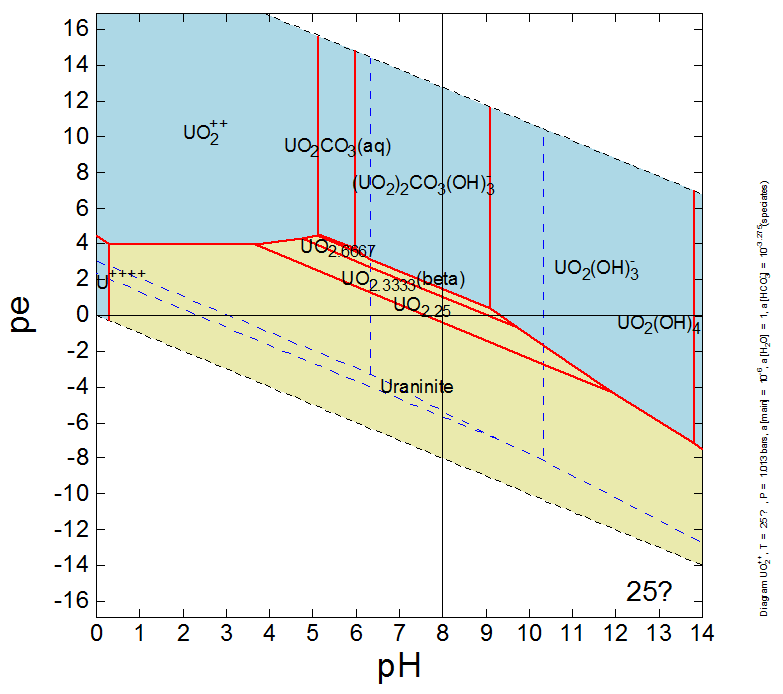
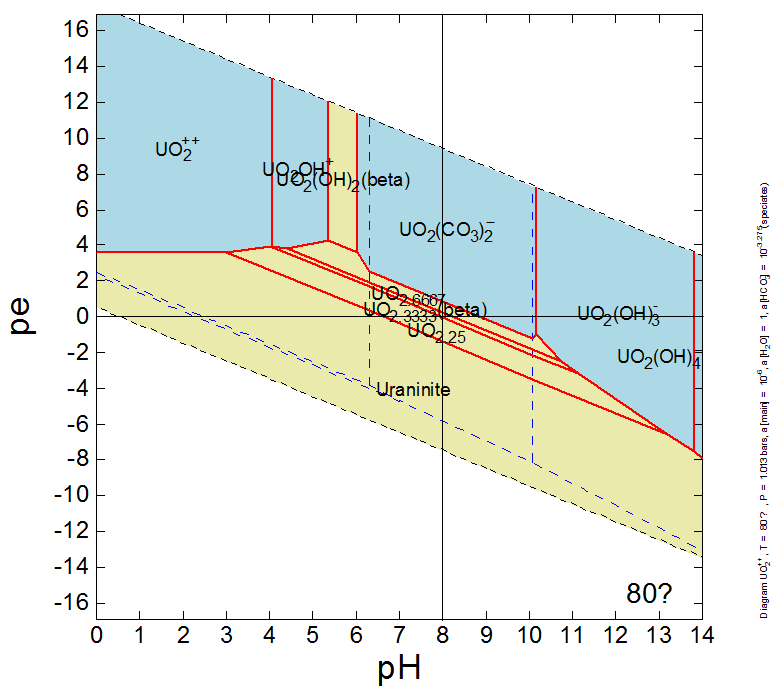
Dear Tom:
I use the Act2 program(GWB 8.0.8) to draw the pe-pH diagram of UO2++.
The basic information are as follows:
UO2++(total) = 1.000000E-06 (M)
|
HCO3-(total) = 5.304055E-04 (M)
T=25C & 80C
The results are shown as attachment.
From the results, we can see when pH=8 and pe=0,
the predominant species is UO2.25 at 25C, and the predominant species is UO2.3333(beta) at 80C.
But when I use the React program to perform the speciation modeling, it shows:
UO2.3333(beta) ppt at pH=8 and pe=0 at T=25C,
UO2.6667 ppt at pH=8 and pe=0 at T=80C.
The results from React and Act2 are different. Why?
Could you help me to confirm these results. Thanks a lot.
Kelvin


-
Dear Tom:
Sorry. I try to express my question in attachment again.
I hope you can understand.
Regards,
Kelvin
-
Hi Tom:
Sorry, I am new in GWB.
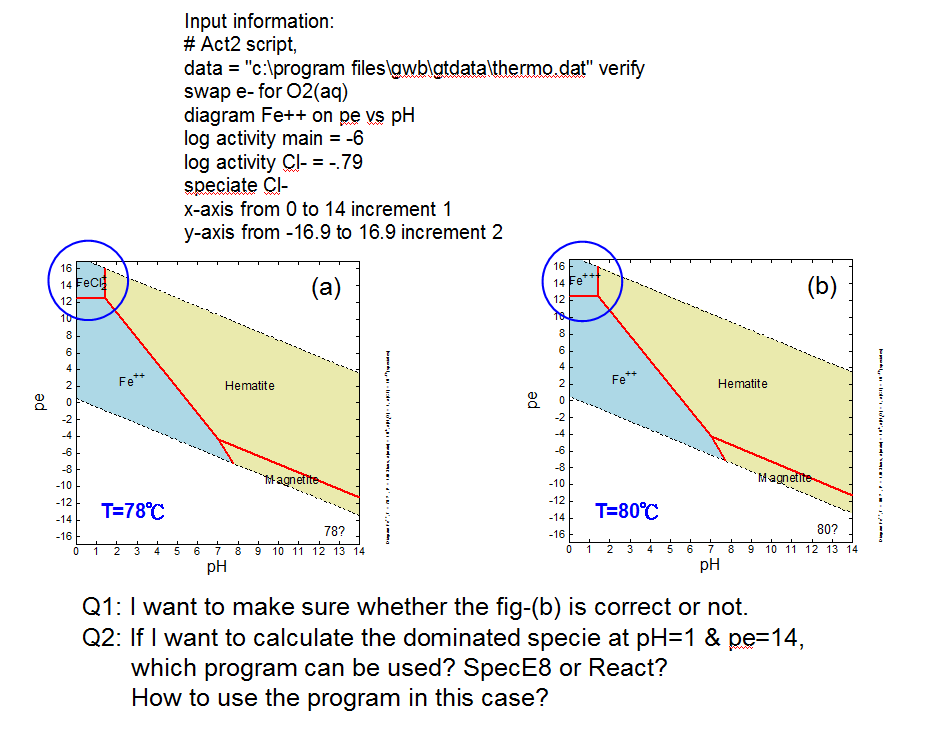
As mentioned above(see the second attachment), if I want to know the predominance of species in system at pH=1 & pe=14, how can I do?
-
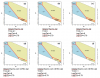
Dear Tom:
Thanks for your help. After turning on the "extrapolate" option, it looks like OK.
But when I built it at 80C, it looks like a little strange(see attachments).
My questions are as follows:
1.Can I extend the temperature range to 80C via "extrapolate" option ?
2.Does it have temperature calibration in "thermo.com.v8.r6+.dat" ?
3.The waterlimit line looks like strange. Is it correct?
Sincerely,
Kelvin
-
Dear Tom:
Yes, I run GWB in Window Vista Chinese version.
Regards,
Kelvin
-
Hi,
I use Act2 to built a Eh-pH diagram.
But the plot can't display the correct temperature unit(ex. 25℃ ---> show 25蚓 or 25?).
How can I do?
-
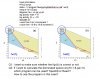
Hi,
I use GWB pro. 8.0 to built the Eh-pH diagram of Fe in the presence of Cl-,
the input informations are as follows:
# Act2 script,
data = "c:\program files\gwb\gtdata\thermo.dat" verify
swap e- for O2(aq)
diagram Fe++ on pe vs pH
log activity main = -6
log activity Cl- = -.79
speciate Cl-
x-axis from 0 to 14 increment 1
y-axis from -16.9 to 16.9 increment 2
When I change the temperature condition(ex. 24.9C, 25C, 25.1C), the results seem the same(fig(a)~©).
But when I change the database(thermo.com.v8.r6+), the results seem different(fig(d)~(f)). Why??
Thanks a lot.


Pourbaix diagram of Cu
in The Geochemist's Workbench
Posted
Dear Tom:
Could you tell me what happen about my question?
Regard,
Kelvin